2015 – Validation of ERMES products and tools
The ERMES products, at regional and local level, as well as the tools (i.e. the Geoportal and the smart App) are subject to a periodic evaluation of their quality. In the scientific framework, this quality evaluation of maps and software, is performed by the so-called validation activities .
For each product (or tool) there is a specific validation procedure or protocol, for assuring its scientific soundness together with its level of achievement as compared to initial requirements (i.e. expectations).
The two main questions are:
1) are we building the product right?
2) are we building the right product?
At the end of the ERMES services’ demonstration for 2015 season we had demonstrated a suite of products, mainly maps and modelling results, and of software tools, to enable users to exploit the ERMES services. Some specific documents (D8.1, D8.3, D8.5) collect i) the approaches designed for validating single products/tools, ii) the validation activities conducted on the results obtained for the 2015 season, ii) the lesson learnt, and some indications for the forthcoming 2016 season.
Field activities and reference data for validation
To perform scientific validation some independent/reference data are needed, e.g. if we want to understand the quality of potential yield estimation by modelling, we need to compare them with actual yields on the same area. If we want to be sure of the results, we need that the number of comparisons is high enough and spatially distributed to be trustable.
This is a reason why a great effort has been spent by the consortium to collect the needed independent data, directly in the field (http://www.ermes-fp7space.eu/activities-and-results/field-campaigns/) or by other sources (e.g. official statistics, farmers’ knowledge).
As an example, to account for the quality of the Leaf Area Index (LAI) maps (http://www.ermes-fp7space.eu/result-ach/2015-multitemporal-lai-maps/), several LAI field measurements were collected in the three different countries involved in the project (Greece, Italy and Spain).
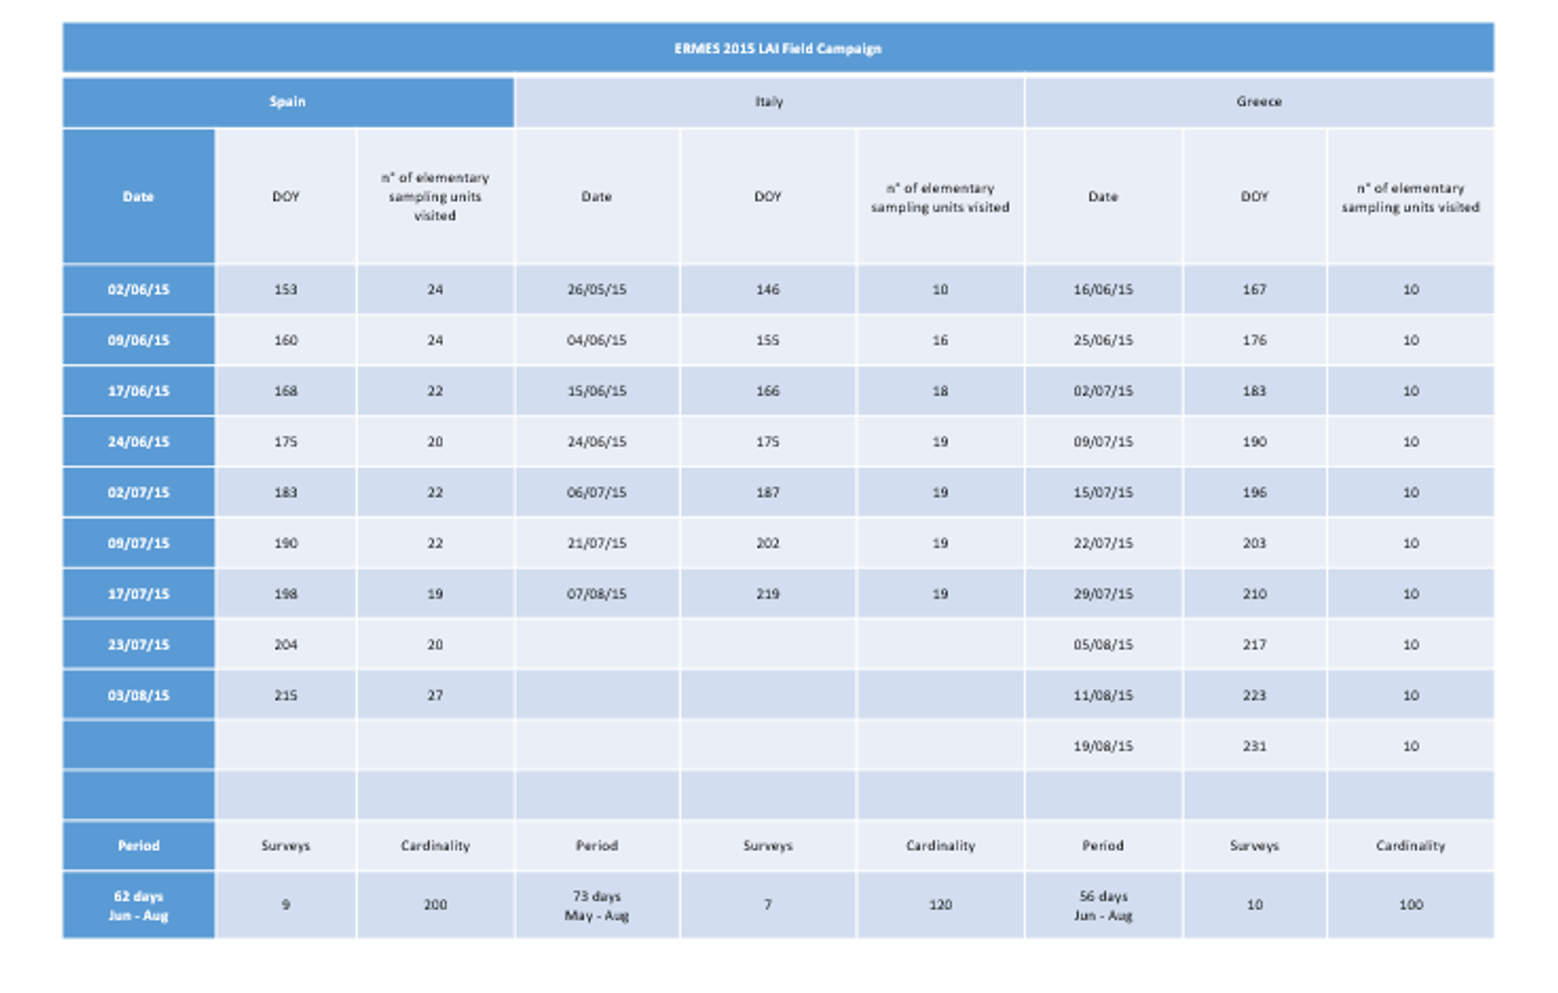
Summary of field activities performed in each local study area for 2015 (click to enlarge)
As a whole the level of quality achieved by the ERMES services’ single components in 2015, both in terms of “building the products right” and “building the right products” is good. Given the good results obtained, there is still room for improvements in the 2016 season, and the final validation results will be produced after this second year of demonstration.
An example of validation exercise for LAI maps
We report here as an example the performance of the high resolution multitemporal LAI product (EP_L4).

Scatterplots of the estimated LAI values (product EP_L4 – High resolution Biophysical parameters maps) and the corresponding in situ measurements in the three countries during the 2015 season, showing their good agreement (click to enlarge).
From single ERMES EO product to Service validation: modelling output
As an example of yield modelling results at regional scale you can see this page: http://www.ermes-fp7space.eu/result-ach/2015-yield-forecasting-focus-on-greece/ while the results of local modelling solution in the three Countries is reported in the following figure
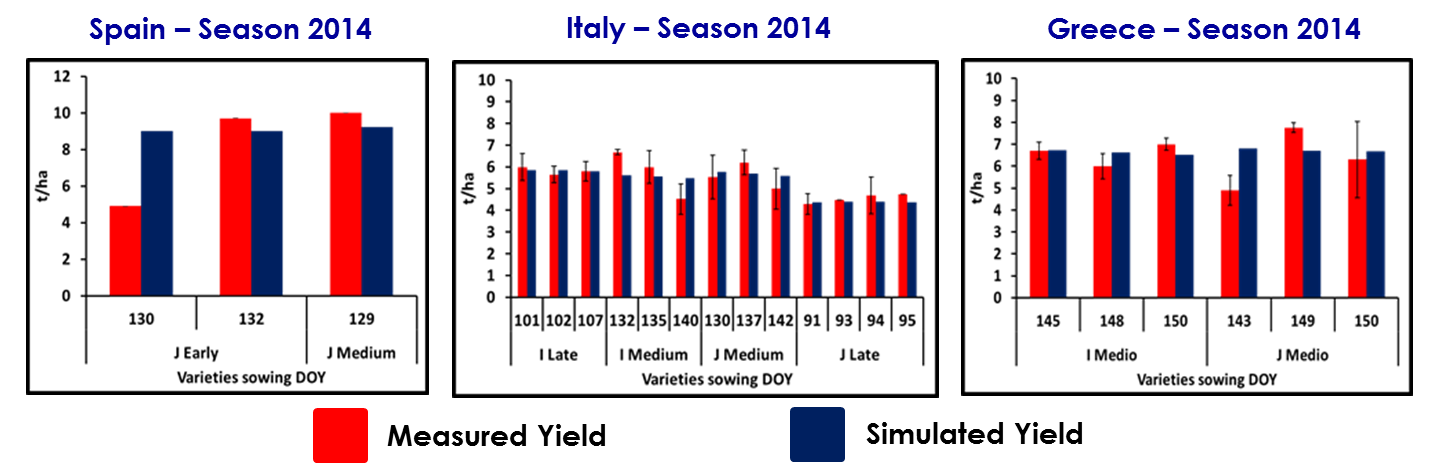
Examples of comparison between measured and estimated yield in Spain, Italy and Greece (click to enlarge).