2014 – Phenological Mapping
The first proototypes of ERMES phenological maps were developed by CNR-IREA in the framework of activities dedicated to the development of processing chains for ERMES products creation.
ERMES phenological maps are derived from analysis of 250m spatial resolution satellite images acquired by the MODIS sensor during the rice growing season using an algorithm specifically developed for rice crop growth monitoring. Results of the analysis are then aggregated on a regular 2×2 km grid, and provide estimates of the average sowing, emergenge and heading dates of rice crops within each cell.
Example maps obtained for the Italian, Greek and Spanish study areas are shown below.
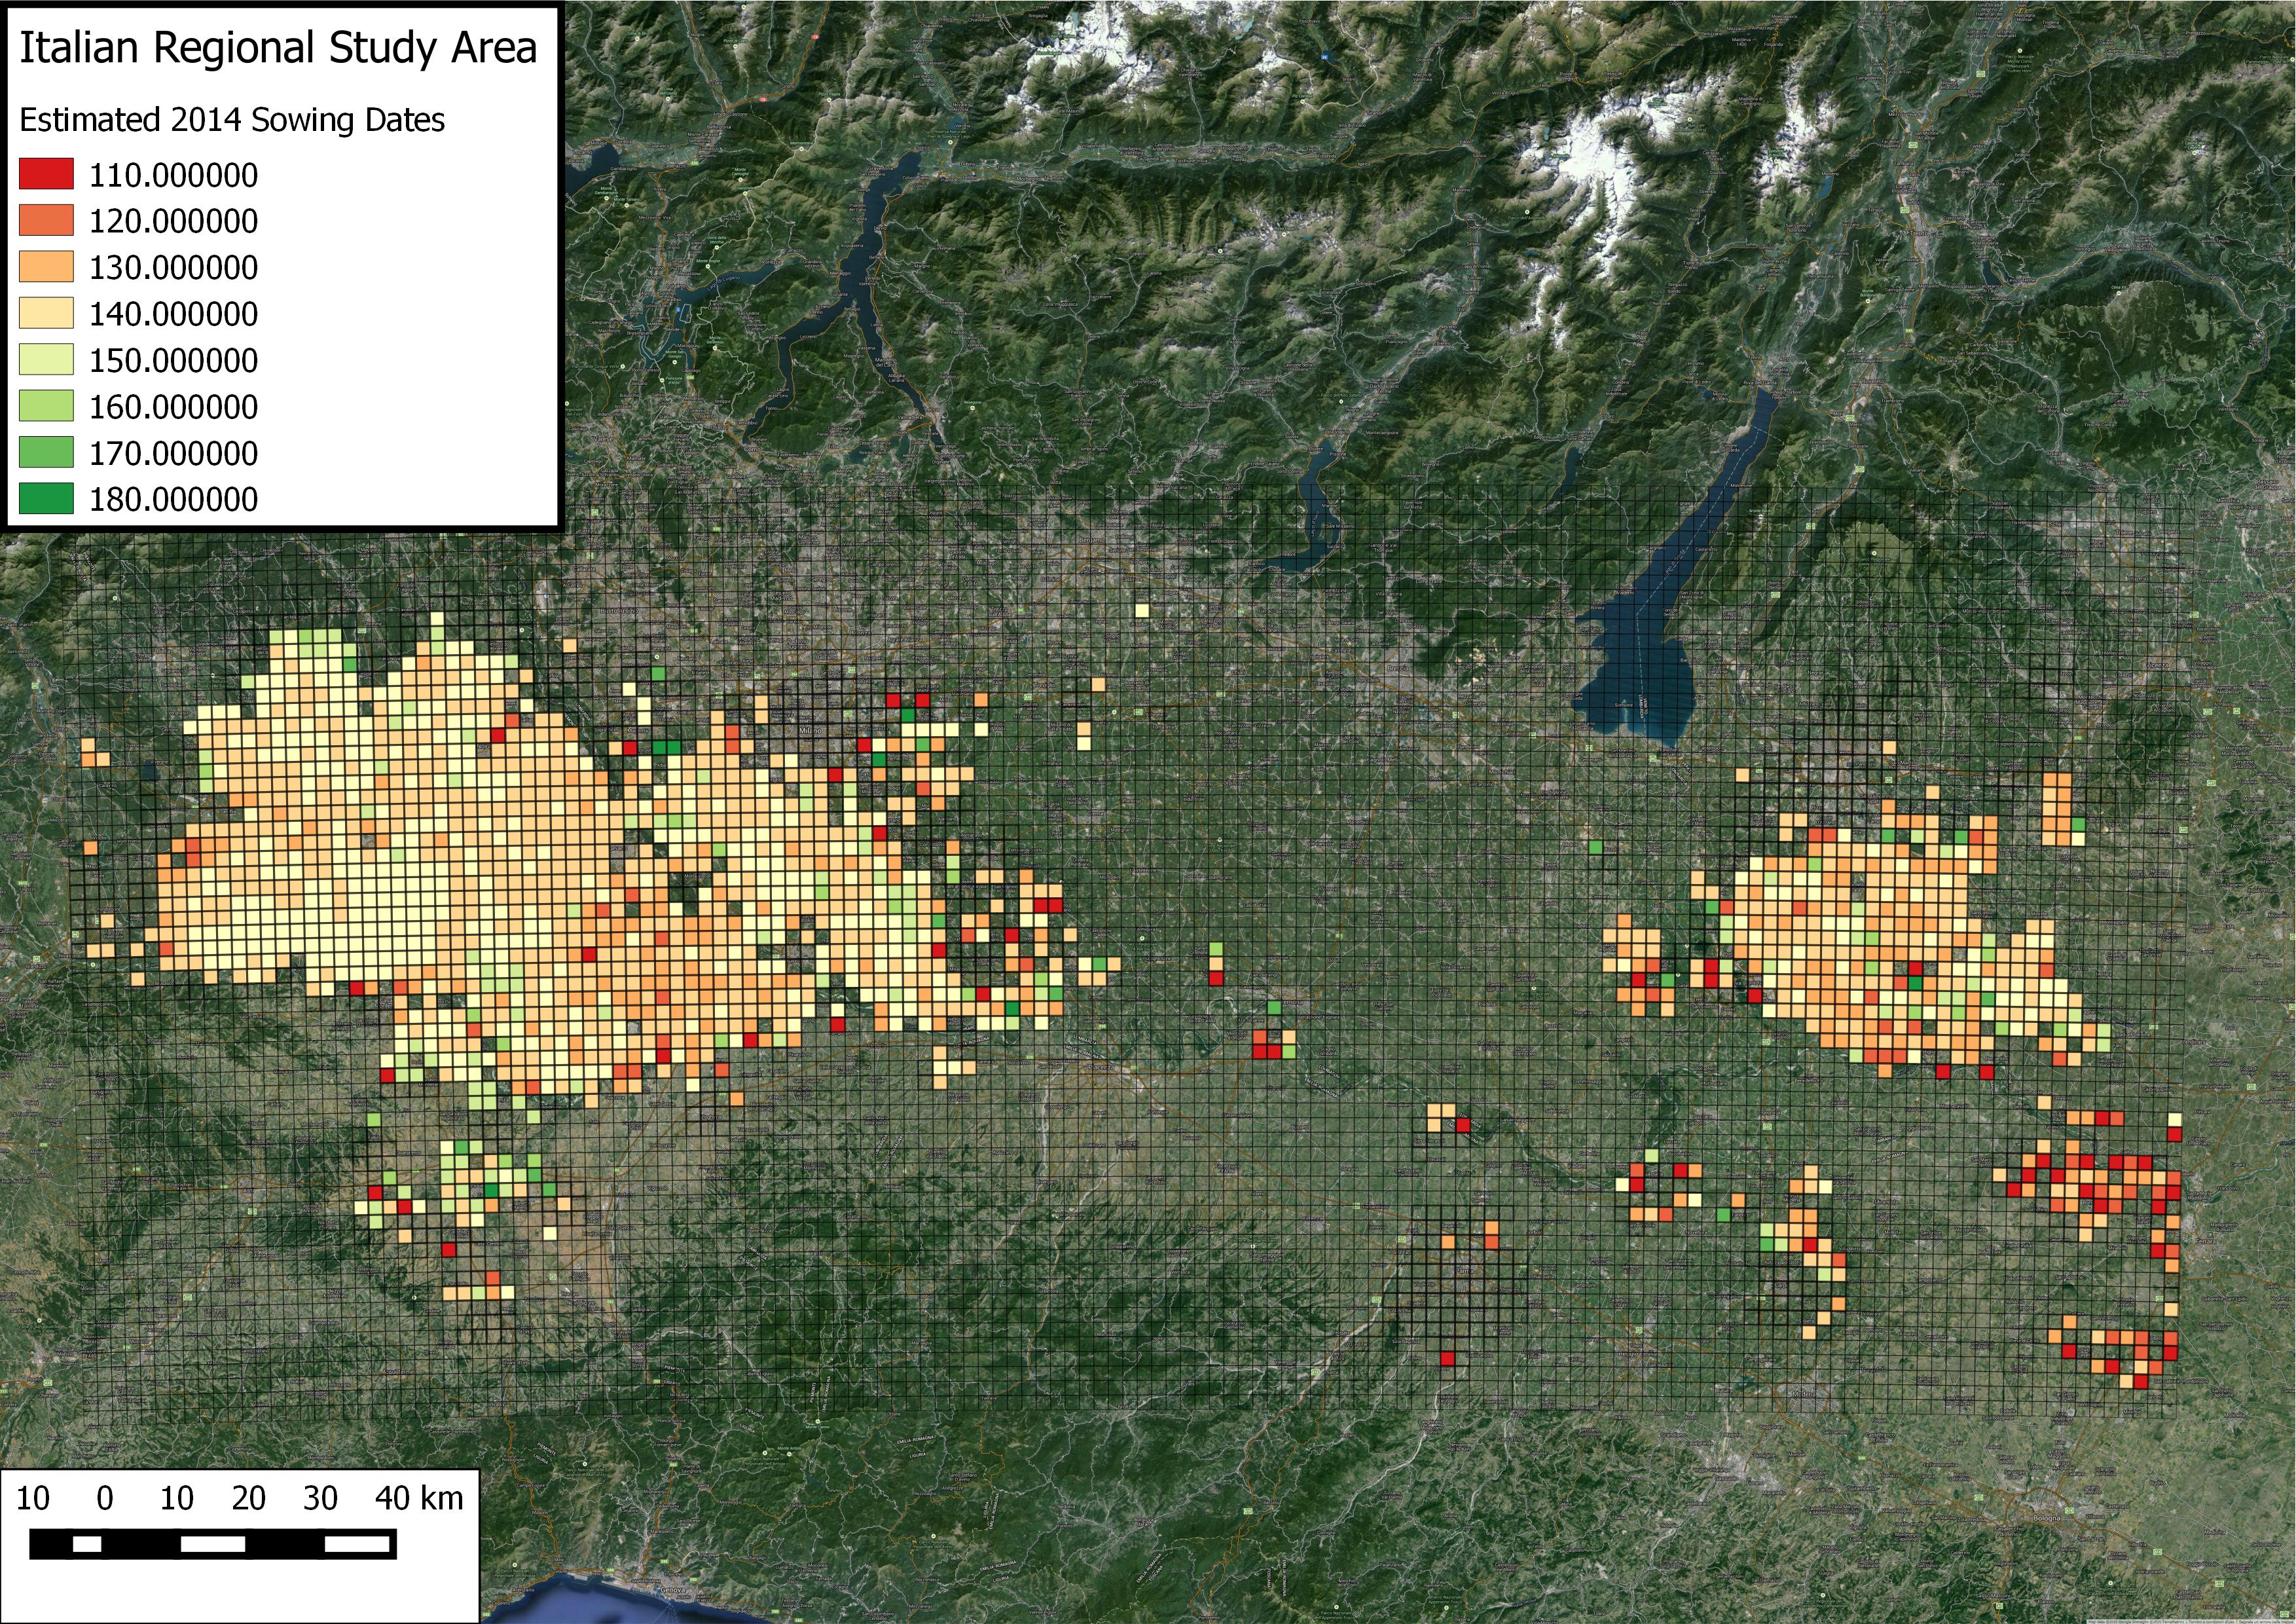


Estimated Sowing Dates for 2014 in Italy (left), Spain (Center) and Greece (Right) – Click to enlarge
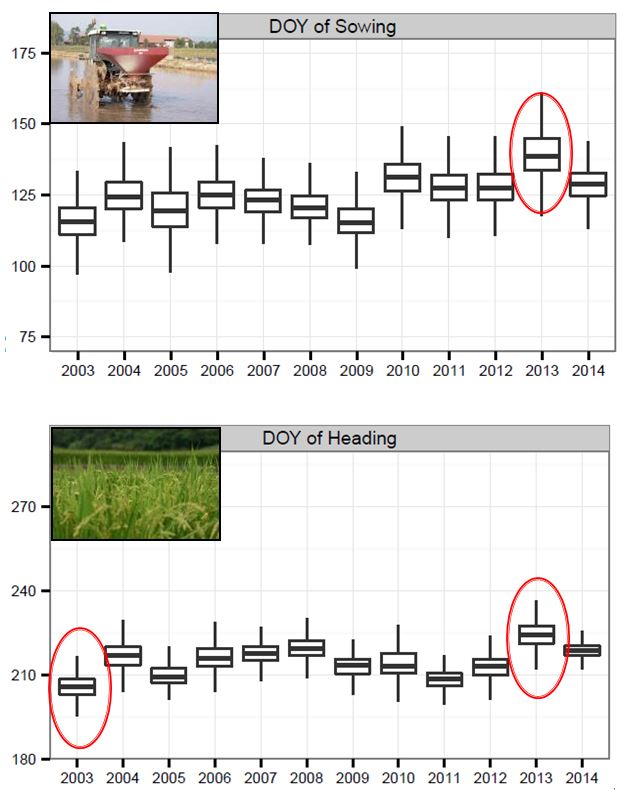
Interannual variability in estimated sowing and heading dates for the Italian regional study area. Analysis Highlight the strong delay occurred in italian sowing dates in 2013 as a result of an unusually wet spring
ERMES phenological maps will be valuable tools since they allow both to highlight anomalous conditions in the rice growing season related for example to particular meteorological conditions and to analyze the variability in space of rice crop phenology and agricultural practices.
Moreover, they will provide valuable input information for the WARM model simulations, allowing to better simulate crop growth in the different areas.
Phenological Maps will be created for all ERMES Regional Study Areas both for 2015 and 2016, and made available to ERMES users through the ERMES Geoportal and Online catalog.